Department of Public Health & Preventive Medicine: Menu

National Iodine Deficiency Disorders Control Programme Status Report

  • National  Iodine  Deficiency  Disorders Control Programme is implemented from the year 1991.

  • IDD Cell is functioning from 1.7.1994.
  • Total BAN  for selling non iodised salt for edible purposes is in force from 1.1.1995.
  • The ban has been extended for another period of five  years  from 1.1.2000.
  • Iodised salt is being sold at a subsidised rate  of  Rs.2.50  per kg.in  Public Distribution System outlets in all the districts of Tamil Nadu except Kanyakumari district.
  • Goitre Surveys  are  conducted  from  1990.  All the 29 districts have been covered. (ANNEXURE I)
  • Goitre is prevalent in all the districts.  18 districts out of 29 have more than 10 % prevalance.
  • Spot testing for iodine is done using MBI spot test kits.

STRENGTHENING OF IODINE DEFICIENCY DISORDER CELL LABORATORY

The  Government  of  India   have   supplied   Laboratory equipments  worth  of  Rs.3  lakhs  for conducting Urinary Iodine analysis. The  Central  Nutrition  Bureau  Laboratory  of  this        Directorate is  carrying  out  this  activity.    Two  Laboratory Assistants  are  already  trained  at   National   Institute   of  Communicable Diseases,  New  Delhi.  During  the year 2000, 123 samples of urine were analysed out of which 19 were found  to  be normal  (25  and  above  microgram  of Iodine) and 104 were belownormal (below 25 microgram of Iodine).

During the year 2001, 100 samples of urine were analysed and all 100 were found to be below normal.

ACTIVITIES UNDER NIDDCP (1998 - 1999)

1.  Celebration of Global IDD day at Chennai.
2.  Advocacy workshops for school teachers at Chennai, T.Kallupatti, Muningipatti and Krishnagiri DIET centres
3.  Preparation of IEC materials like 8600 Acrilic table display and 10000 stickers.
4.  Goitre surveys in six districts.

ACTIVITIES UNDER NIDDCP (1999 - 2000)

1.  State level advisory committee meeting on IDD program at the Directorate.
2.  Goitre surveys in five districts.
3.  Supply of 4000 MBI Spot test kits.
4.  Preparation of IEC materials:

    a   One line stickers for bumpers of vehicles- 10000 numbers.
    b.  Danglers for the retailers selling Iodised salt-25000 numbers
    c.  Preparation  of  Jingles on Iodised salt (12 numbers 1 minute jingles and 12 numbers of half minute jingles) for broadcasting through All India Radio.
    d.  Preparation of 154 Nos of Audio cassettes  containing  Iodised salt jingles recorded in between Tamil film hit songs for the use field publicity.
    e.  Preparation  of  50  Nos. Photo blowups on IDD to serve as exhibits for publicity purposes in exhibitions.
    f.  A state level survey was conducted during 1999 to assess  the awareness, availabilty and  acceptability of Iodised  salt in rural Tamilnadu. (The results are put up in ANNEXURE II).

ACTIVITIES UNDER NIDDCP (2000 - 2001)
1. Supply of 21500 MBI kits to districts for doing spot tests.
2. It is proposed to obtain funds from the government to pay for the broadcasting of Jingles already prepared during  the  prime  time in AIR.
3. It is  proposed to conduct  the  State  level  Advisory  committee meeting for this year.
4. It is proposed to take up Goitre surveys in six districts.
5. Preparation of IEC materials.
6. Celebration of Global IDD day on 21/10/2000.

ACTIVITIES UNDER NIDDCP (2001 - 2002)
1. An article on I.D.D was published in Yearly Health Magazine 'DINAMANI MARUTHUVAMALAR' in Tamil to promote Iodised Salt.
2. The  importance  of  Iodised  Salt  was  stressed  through  an advertisement in the same Magazine.
3. Booklets on I.D.D in  Tamil  were  prepared  and  supplied  to Deputy Directors of Health Services for distribution to school students.
4. Global IDD Day was celebrated on 21st October 2001. A talk on I.D.D was broadcasted through All India Radio in a programme called 'Manai Mangalam'
5. Regular classes and demonstrations are  conducted  to  Medical students  and  para-medical health personnel on I.D.D and the importance of Iodised Salt.
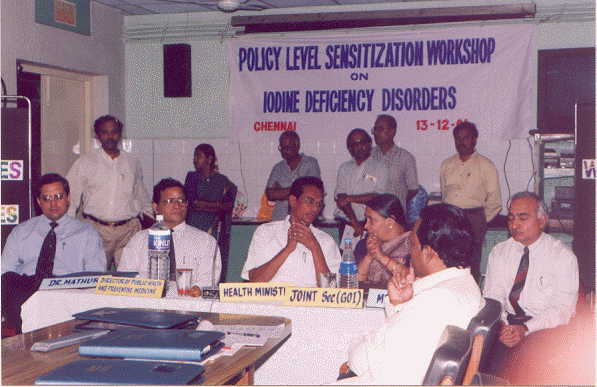
6. Policy level sensitization workshop on Iodine Deficiency Disorders was organized at Chennai on 13.12.2001.

DECISION TAKEN BY GOVERNMENT OF INDIA

The State Health Ministers meeting was held on  31.8.2000 to  discuss  the  issue  of  compulsory  iodisation  of salt as a strategy to combat Iodine Deficiency Disorders.  The  matter  has been examined  comprehensively by the Government.  In view of the decision to withdraw the earlier central notification introducing compulsory iodisation of salt for direct human consumption it has requested that State Governments may consider the need for having statutory provision for compulsory iodisation of salt  under  the PFA  Act  1954,  covering part or  whole of the State, In view of above, in the State of Tamilnadu  the  ban  on  common  salt  for edible purpose will continue for another 5 years with effect from  1.1.2000.

   ANNEXURE I        RESULTS OF GOITRE SURVEYS

------------------------------------------------------------------

 S.No.      District       Year       Cases       Goitre      %

 ------------------------------------------------------------------

  1.  Ramanathapuram       1995       13718       2464      18.0

  2.  The Nilgiris         1999       19659       3273      16.6

  3.  Thiruvarur           1998       12496       1817      14.5

  4.  Salem                1999       46514       5802      12.5

  5.  Virudhunagar         1995       11000       1437      13.1

  6.  Villupuram           1999       44700       5376      12.0

  7.  Coimbatore           1995       36999       4316      11.7

  8.  Kanniyakumari        1999       25243       2966      11.7

  9.  Dharmapuri           1999       65792       7576      11.5

 10.  Pudukottai           1998       24603       2741      11.1

 11.  Namakkal             1998       12789       1338      10.5

 12.  Nagapattinam         1998       14185       1471      10.4

 13.  Erode                1998       22342       2321      10.4

 14.  Perambalur           1999       25240       2636      10.4

 15.  Tuticorin            1995       18119       1865      10.3

 16.  Thanjavur            1998       16337       1659      10.2

 17.  Chennai              1996       25483       2567      10.1

 18.  Trichirapalli        1999       33523       3362      10.0

 19.  Theni                1998       14549       1350       9.3

 20.  Thiruvannamalai      1999       48848       4563       9.3

 21.  Dindigul             1999       53719       4742       8.8

 22.  Vellore              1997       36331       3085       8.5

 23.  Kancheepuram         1997       21301       1680       7.9

 24.  Cuddalore            2000       45592       3547       7.8

 25.  Sivaganga            1995       23868       1815       7.6

 26.  Thiruvallur          1996       19823       1480       7.5

 27.  Tirunelveli          1995       27674       1928       7.0

 28   Madurai              2000       42506       2687       6.3

 29.  Karur                2000       29614       1057       3.6

--------------------------------------------------------------------

  ANNEXURE  II A SURVEY ON THE AWARENESS, AVAILABILITY AND ACCEPTABILITY OF IODISED SALT -  RESULTS AT A GLANCE    ----------------------------------------------------------------------------------

         DETAILS                           GROUP A    GROUP B     STATE

    ------------------------------------------------------------------------------

    No. of villages surveyed                  270        990       1260

    No. of households surveyed               5100      19460      24560

    Retail shops surveyed                    1310       4488       5798

    Ration shops surveyed in Gr.A Dist        180          -        180

    Noonmeal centres surveyed                 457       1640       2097

    School hostels surveyed                    59        228        287

    AWARENESS OF HOUSEHOLDS (%)

         On Iodised salt                       42         35         37

         On Goitre                             15         14         14

    SOURCES OF INFORMATION ON IODISED SALT (%)

         Health staff                          21         20         20

         TV / Radio                            49         43         44

         Newspapers                            10          8          9

         Others                                20         29         27

    IDENTIFICATION OF IODISED SALT BY THE HOUSEHOLDS (%)

         Words 'Iodised Salt' on the packet    81         82         82

         Logo of 'Smiling Sun'                 19         18         18

    AVAILABILITY OF IODISED SALT (%)

         Retailers selling Iodised salt

         as per spot test                      76         50         56

         Ration shops in Gr.A Dist (%)

         selling Iodised salt                 100                   100

    ACCEPTABILITY OF IODISED SALT (%)

         Buying Iodised salt voluntarily       58         37         43

         Households using Iodised salt

         as per spot test                      59         28         35

         Noon meal centres using Iodised

         salt as per spot test                 52         11         20

         School hostels using Iodised salt

         as per spot test                      51         25         30

    REASONS GIVEN BY HOUSEHOLDS NOT USING IODISED SALT (%)

         Costly                                10         19         18

         Not available in the village          13         21         19

         No idea on Iodised salt               77         60         63    -------------------------------------------------------------------

    GROUP A : Trichy, Karur, Perambalur, Thanjavur, Coimbatore,The Nilgiris, Salem, Namakkal Districts where Iodised  salt is sold through PDS.

    GROUP B : Other Districts.

The Salt samples analysed through spot testing is as follows

S.No
Details
2000-2001
2001-2002
2002-2003
 

2003-2004

2004-2005
July' 04

1
Shops visited
67528
83553
97144

131029

36650

 
Sample tested
65050
81211
93416

123485

35436

 
No of samples
Without iodine
With < 15 ppm
With > 15 ppm
 
19676 (30%)
20609 (32%)
24765 (38%)
 
21875 (27%)
27044 (33%)
32292 (40%)
 
22877 (24%)
31649 (34%)
38890 (42%)


23791(19%)
38049(31%)
61645(50%)


7082(20%)
10997(31%)
17357(49%)

2.
Households visited
Households using
Iodised salt
198649
140785 (71%)
201692
154631(77%)
218791
165448 (76%)

316454
272761
(86%)

86748
68952
(79%)

Click here to view Iodine Booklet


| Home | Iodine |